
DIAGNOSE
Identifying the Culture Type
Most leaders can feel culture, but they can’t point to it. That’s because culture isn’t a vibe — it’s an operating system. It’s the invisible rules for how decisions get made and what gets rewarded.
Windows and macOS are both computer operating systems. One isn’t “better” than the other — they’re optimized for different priorities, workflows, and environments. The only time an operating system becomes a problem is when you try to use it for something it wasn’t designed to run. Company culture works the same way.
Every culture is an operating system for decision-making: it determines what counts as a good decision, who gets to act, how fast things move, what gets trusted, and what gets rewarded. The first step to building a great culture is knowing which operating system you’re running — and how it behaves under pressure.
Culture is an Operating System
A culture diagnosis reveals which of the 9 operating systems you’re in (not good or bad — just different), where misalignment is quietly taxing execution and retention, and what to reinforce versus redesign.
When you install the wrong “software”, the wrong decision mechanisms, incentives, communication norms, or leadership style - you don’t get alignment. You get pushback. Confusion. Attrition. People start feeling disrespected, misunderstood, or blocked. Not because they’re difficult. But because the system is incompatible.
But when you design for the operating system you’re actually in, everything compounds. Decisions move. Teams stop fighting the system. Compatibility becomes predictable.
That’s what the Culture Map is for.
The Culture Map
The Relationality logo is the Culture Map.
It’s a visual shorthand for the decision operating system running underneath a team or organization — the patterns of:
what gets rewarded
how conflict is handled
how boundaries are enforced
what “good” looks like under pressure
It’s designed to be fast to read and easy to use. Once you know what you’re looking at, you can spot compatibility and friction immediately — without over-explaining.
How It Works
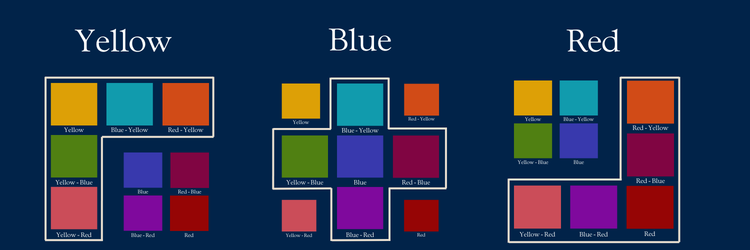
The logo is built on three primary decision colors: Yellow, Blue, and Red. These primary culture colors combine into distinct blends, and the dominant color changes the behavior of the whole system.
That’s why the logo isn’t just a palette - it’s an arrangement. The colors are organized in a matrix, so you can see how different combinations relate to each other at a glance. In other words, it shows the relationality of all cultures - or how they relate to each other.
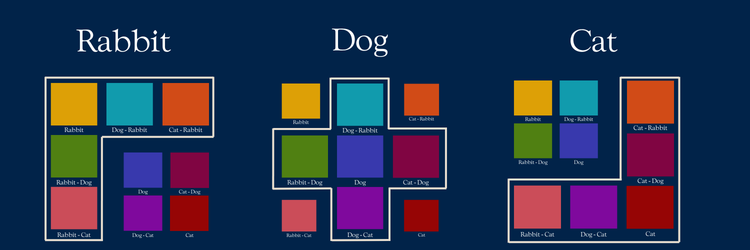
Animal Mascots as Culture Archetypes
Culture doesn’t just have values. It has a default conflict style. Relationality uses three animal archetypes to make that style instantly recognizable:
New York City is an example of a Cat culture. (Red)
It’s conflict-forward, boundary-clear, and efficiency-minded. If you cross someone’s line, you’ll hear about it. The pace is fast, people are direct, and the energy is individualistic and innovation-oriented. And even with the sharp edges, it’s often surprisingly helpful in practical ways — people will give directions, tell you the truth, and keep it moving.
American Midwest is an example of a Dog culture. (Blue)
It’s rule-based in the “we do things like this around here” way. The mechanism is shared norms: consistency, reliability, and a strong sense of responsibility. Dog cultures reward loyalty, hard work, and stability — and they make it easier to trust the system because expectations are clear. If you’re out of step, you’ll feel it, but the upside is a culture that’s steady, collaborative, and built to hold.
Utah is an example of a Rabbit culture. (Yellow)
It’s relationship-first and community-oriented. People lead with generosity, support, and a strong instinct to take care of the group. Rabbit cultures tend to prioritize harmony and cohesion — not by ignoring problems, but by trying to handle tension in ways that preserve connection and avoid unnecessary conflict. They’re often high-trust cultures: people show up, lend a hand, include others, and keep things running through quiet cooperation. The pace can feel calmer, the tone can feel more considerate, and the culture often rewards contribution and care.
None of these are “better” than another - they’re just different operating systems. But each of them rewards different ways of communicating, deciding, and handling conflict.
Animal Mascots Indicate Compatibility
The animal mascots are an extremely practical tool that indicates compatibility across all layers of scale:
individual ↔ individual
individual ↔ culture
culture ↔ culture
Some culture types are represented by a particular combination of two animal mascots that represent a hybrid operating system with its one unique structure and drivers. For example:
Southern California is an example of a Dog–Rabbit culture (Turquoise)
This is where “perception is reality” becomes operational: credibility often travels through aesthetics, status signals, and relational positioning, while norms are enforced through inclusion, exclusion, and subtle correction rather than direct confrontation. Dog shows up through strong, image-driven norms and an unspoken “there’s a right way to do this here.” Rabbit shows up through social harmony and careful conflict management. The result is a culture where perception carries real power: reputation, optics, and social signals often determine what’s considered credible. Conflict is less likely to be direct and more likely to be managed through tone, social alignment, and indirect enforcement of norms.
Since this culture type is represented by 2 different animal mascots it will be compatibility with both ‘Dog’ and ‘Rabbit’ cultural components.
Proprietary Culture Diagnostic
The Culture Type Test reveals the operating system running your culture.
It shows why certain decisions move fast or stall, what’s driving behavior, what’s being reinforced, and where friction is structurally predictable. Instead of guessing, leaders get decision-grade clarity on what to reinforce and what to redesign.
MAP tells you what the system is built to optimize. PRISM—like light through a prism—breaks culture into visible, measurable signals: rewards, information flow, rules, and failure patterns. It’s through this lens that culture becomes strategy.
MAP
MAP describes the core engine of a culture — how it moves, what gives it the right to act, and where its power comes from.
M — Modus Operandi
The culture’s primary driver or way of creating value.A — Authority
What gives someone the right to act within that culture.P — Power
The currency that determines influence and status.
PRISM
PRISM describes the operating conditions of a culture — how it reacts, what it rewards, how information moves, what rules govern behavior, and what the culture becomes as a result.
P — Performance Failure
What failure looks like in that culture.R — Reward Mechanism
What the culture reinforces and elevates.I — Information Flow
How truth, signals, and influence spread.S — System Rules
The formal or informal rules that shape behavior.M — Manifestation
What the culture feels like on the ground when all of the above are in motion.
Then Align with Strategy
Most people can tell you whether a culture feels “good” or “bad.” Hardly anyone can tell you what a healthier version of that specific culture looks like. That’s because culture isn’t one universal thing. There are 9 different culture types, and “healthy” looks different in each. What’s high-performing in one operating system can be toxic in another.
MAP shows what drives the culture—so you can check whether those drivers are compatible with the strategy and the reality of your industry.
PRISM shows how that culture behaves in practice—by breaking it into standardized signals (rewards, information flow, rules, failure patterns) and measuring whether they’re high- or low-functioning within the context of that culture type.
A culture diagnosis shows what’s driving your system, how it behaves under pressure, and where misalignment is quietly taxing execution and retention. Together, MAP and PRISM bring decision-grade clarity to your culture around uncertainties such as: hiring, firing, and whether your operating system is in alignment with your strategy.
“Culture
Eats Strategy for Breakfast.”
-Peter Drucker
Culture Mapping
Map Your Culture:
A Culture Map reduces decision friction.
It shows what to reinforce, what to stop rewarding, and where incompatibility will become expensive if left unnamed. For most organizations, preventing one mis-hire or one leadership deadlock cycle can pay for the work.